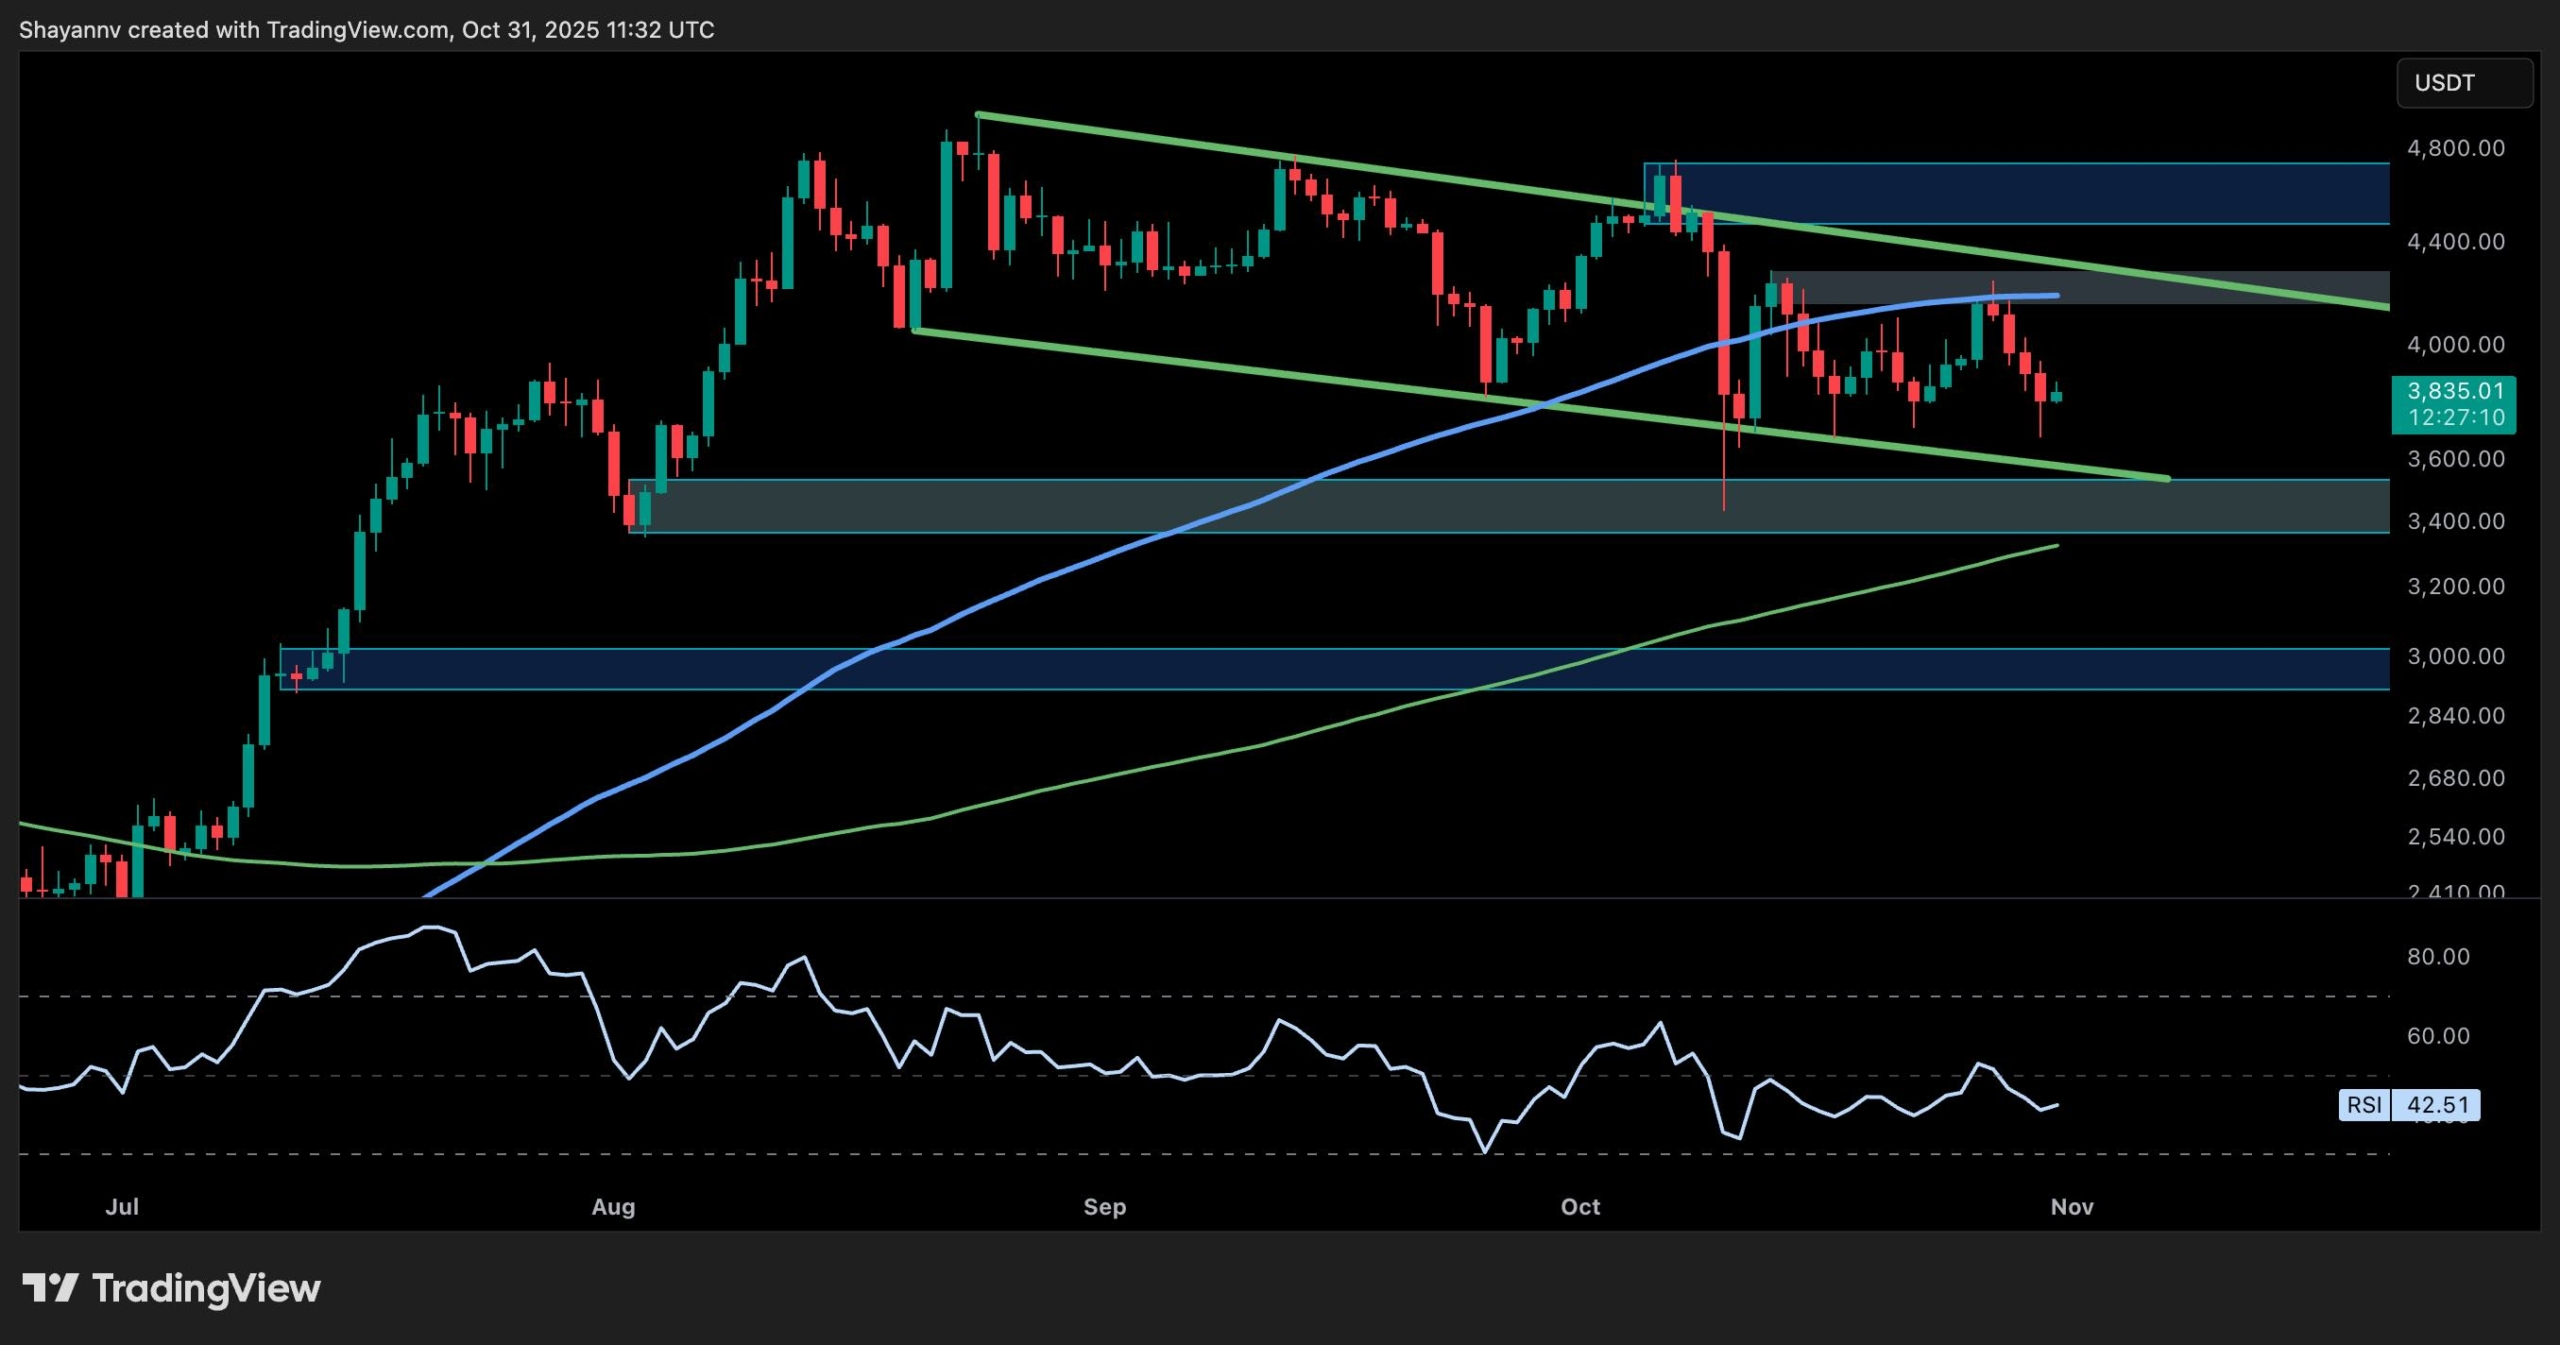
Ethereum has been showing signs of weakness after failing to reclaim the key $4,200 resistance. Despite strong bullish momentum earlier this month, price action remains capped within a descending channel, and the recent bounce has been relatively weak. Traders are now watching to see whether ETH can establish a higher low or if further downside is to come. Technical Analysis By Shayan The Daily Chart Ethereum continues to respect the boundaries of the descending parallel channel, with multiple rejections from the upper trendline. The most recent attempt to break out near $4,200 failed, sending the price back toward the mid-range and testing support around $3,700. The asset is still holding above the 200-day moving average for now, which is a critical dynamic support level, but we’re now seeing lower highs form, which is a sign of weakening bullish momentum. The RSI on the daily has also dropped to around 42. This reflects a cooling off in buying pressure without yet entering full oversold conditions. If ETH loses the $3,700 support, the next major demand zone lies around $3,400, where the lower channel support and a horizontal level intersect. However, if buyers can reclaim the $4,000 region, another test of the $4,200 level would be very likely. The 4-Hour Chart On the 4-hour chart, the picture becomes more granular. After the recent rejection from $4,200, ETH saw a sharp drop into the lows of the range, which was swept before a small bounce emerged. The price is currently hovering around $3,800 and attempting to reclaim momentum. The RSI also hit oversold territory and has now started turning up, indicating a potential short-term relief rally or range-bound consolidation. Despite the small bounce, ETH remains under the key resistance zone at $4,000. This area will be crucial, as a clean break and close above it would signal renewed buyer interest. Until then, short-term rallies may face selling pressure. If the current bounce loses steam, ETH could revisit the $3,650 low or even test the $3,400 demand zone, aligning with the bottom of the larger descending channel. Sentiment Analysis Open Interest Open Interest on Ethereum has seen a significant reset, falling sharply from over $32 billion down to around $22.8 billion. This drop reflects a broad deleveraging across the market, likely triggered by a combination of stop hunts, liquidations, and risk-off behavior from traders. The rapid flush of open positions suggests that many overexposed longs were forced out, especially after ETH’s rejection from the $4,200 resistance area. Such a sharp OI decline is often a necessary clean-up to reset overheated conditions. When leverage builds up too aggressively, markets tend to shake out weak hands before establishing a more stable trend. That’s what appears to have happened here. However, what’s notable is the current stagnation, as open interest has not rebounded with price, which signals that traders are still hesitant to re-enter in size. The post Ethereum Price Analysis: This Support Stands Between ETH and a Sub-$3.5K Drop appeared first on CryptoPotato.

More Headlines

Bullish Signals: 3 Trending Cryptos to Get On Halloween 2025 As Market Turns Red – XRP, BTC, SOL?
CryptoNews.com

BNB Coin Price Prediction: As Market Sentiment Turns Grim, Can BNB Shift And Reach a New ATH in November?
CryptoNews.com

Ethereum Support Band Under Pressure — Can Bulls Revive Momentum From $3,700?
NewsBTC

XRP Price Prediction: Canary XRP ETF Verdict Drops November 13, Traders Brace for Massive Price Move – Pump or Dump?
CryptoNews.com

Ethereum Price Prediction: Is ETH About to Dump as Millions in October Options Positions Expire Today?
CryptoNews.com
Crypto News Today, October 31 – BTC Price USD Bounces Back To $110K But XRP Slips Below $2.5 And ETH At $3.8K: Best Crypto To Buy?
99bitcoins
