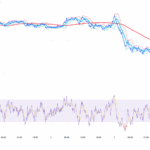
XRP price started a fresh decline below $2.350. The price is now showing bearish signs and is at risk of more losses below $2.120 in the near term. XRP price gained bearish momentum and traded below $2.30. The price is now trading below $2.250 and the 100-hourly Simple Moving Average. There is a bearish trend line forming with resistance at $2.250 on the hourly chart of the XRP/USD pair (data source from Kraken). The pair could start a recovery wave if it stays above $2.150. XRP Price Dips Further XRP price remained in a bearish zone below $2.50 and extended losses, like Bitcoin and Ethereum. The price dipped below the $2.350 and $2.30 levels. The decline gained pace after there was a close below $2.250. The price even tested $2.050. A low was formed at $2.066, and the price is now correcting some losses. There was a move above the 23.6% Fib retracement level of the downward move from the $2.552 swing high to the $2.066 low. The price is now trading below $2.30 and the 100-hourly Simple Moving Average. If there is a fresh upward move, the price might face resistance near the $2.250 level. There is also a bearish trend line forming with resistance at $2.250 on the hourly chart of the XRP/USD pair. The first major resistance is near the $2.30 level, above which the price could rise and test $2.3650. It is close to the 61.8% Fib retracement level of the downward move from the $2.552 swing high to the $2.066 low. A clear move above the $2.3650 resistance might send the price toward the $2.420 resistance. Any more gains might send the price toward the $2.450 resistance. The next major hurdle for the bulls might be near $2.50. Another Decline? If XRP fails to clear the $2.30 resistance zone, it could start a fresh decline. Initial support on the downside is near the $2.180 level. The next major support is near the $2.150 level. If there is a downside break and a close below the $2.150 level, the price might continue to decline toward $2.050. The next major support sits near the $2.00 zone, below which the price could continue lower toward $1.850. Technical Indicators Hourly MACD – The MACD for XRP/USD is now losing pace in the bearish zone. Hourly RSI (Relative Strength Index) – The RSI for XRP/USD is now below the 50 level. Major Support Levels – $2.180 and $2.150. Major Resistance Levels – $2.250 and $2.30.

More Headlines

Crypto Price Prediction Today 4 November – XRP, Official Trump, BNB Coin
CryptoNews.com

Best Crypto to Buy Now 4 November – XRP, Cardano, Shiba Inu
CryptoNews.com

China’s DeepSeek AI Predicts the Price of XRP, Solana, Pi Coin by the End of 2025
CryptoNews.com

Ethereum Turns Negative for 2025 as Crypto Liquidations Exceed $1.1 Billion
BeInCrypto
Now That The Chainlink Price is Dead, What’s Next For It?
99bitcoins

Bitcoin Scrambles to Close October in Green as 2018 Sell-Off Shadows Loom
The Defiant