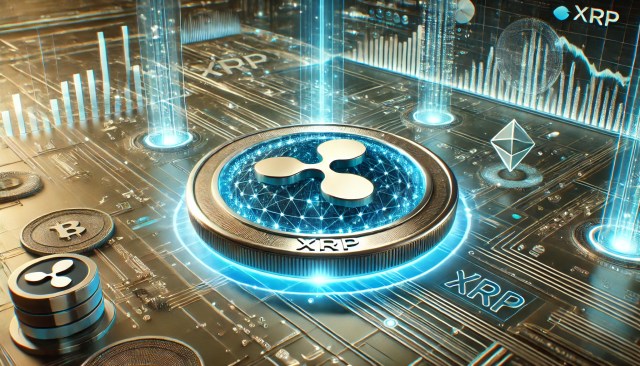
XRP price started a decent increase above $2.420. The price is now consolidating and might aim for another increase if it stays above the $2.350 level. XRP price started a downside correction and tested the $2.320 zone. The price is now trading near $2.420 and the 100-hourly Simple Moving Average. There is a bearish trend line forming with resistance at $2.430 on the hourly chart of the XRP/USD pair (data source from Kraken). The pair could continue to move up if it clears $2.50. XRP Price Eyes Additional Gains XRP price started a downside correction from the $2.580 zone, like Bitcoin and Ethereum. The price dipped below the $2.550 and $2.50 levels to enter a consolidation phase. The price even dipped below the 50% Fib retracement level of the upward move from the $2.240 swing low to the $2.580 high. However, the bulls remained active above the $2.320 support. It is now rising and trading above $2.40. The price is now trading near $2.420 and the 100-hourly Simple Moving Average. If there is a fresh upward move, the price might face resistance near the $2.430 level. There is also a bearish trend line forming with resistance at $2.430 on the hourly chart of the XRP/USD pair. The first major resistance is near the $2.450 level, above which the price could rise and test $2.50. A clear move above the $2.50 resistance might send the price toward the $2.580 resistance. Any more gains might send the price toward the $2.650 resistance. The next major hurdle for the bulls might be near $2.720. Another Decline? If XRP fails to clear the $2.450 resistance zone, it could start a fresh decline. Initial support on the downside is near the $2.3420 level. The next major support is near the $2.320 level and the 76.4% Fib retracement level of the upward move from the $2.240 swing low to the $2.580 high. If there is a downside break and a close below the $2.320 level, the price might continue to decline toward $2.250. The next major support sits near the $2.20 zone, below which the price could continue lower toward $2.120. Technical Indicators Hourly MACD – The MACD for XRP/USD is now gaining pace in the bullish zone. Hourly RSI (Relative Strength Index) – The RSI for XRP/USD is now above the 50 level. Major Support Levels – $2.3420 and $2.320. Major Resistance Levels – $2.450 and $2.50.

More Headlines
Is the XRP ETF About to Get Approved? Bipartisan Senate Vote Could Reopen US Government
BitCoinist

China’s DeepSeek AI Predicts the Price of XRP, Solana, Zcash by the End of 2025
CryptoNews.com

Crypto Markets Drop as Investors Eye House Vote and Inflation Data
The Defiant
Bitcoin Scrambles to Close October in Green as 2018 Sell-Off Shadows Loom
The Defiant

Asia Market Open: Bitcoin Steady, Stocks Mixed as Trump Signs Bill to Reopen US Government
CryptoNews.com

XRP Cup & Handle Breakout Could Trigger $5 Year-End Run
CryptoPotato