XlmLive Feed
Xlm breaking news and instant alerts. Crypto Feed's minimalist interface delivers verified headlines, price movements, and protocol updates the moment they happen. Fast, focused, no fluff.
 Stellar (XLM) Buyer-Seller Standoff Could Be Ending And This Side Is About to Lose
Stellar’s month-long slide may be losing steam. RSI divergence, fading Wyckoff selling signals, and strong $0.30 support suggest buyers could soon regain control. The post Stellar (XLM) Buyer-Seller Standoff Could Be Ending And This Side Is About to Lose...
- Stellar (XLM) Buyer-Seller Standoff Could Be Ending And This Side Is About to Lose
Stellar (XLM) has spent the past month in decline, dropping 14.7% as broader market sentiment weakened. Over the past week, though, the XLM price has traded mostly flat — hinting that the correction could be nearing an end. A few key on-chain and technical indicators now suggest that XLM’s buyer-seller standoff might soon break in favor of the bulls. Read on to know how! The Buyer-Seller Battle Is Visible On the daily chart, XLM trades inside a symmetrical triangle — a pattern that forms when buyers and sellers are evenly matched. It reflects indecision, where lower highs and higher lows compress price into a tighter range before a breakout. The current pattern shows that both the upper and lower trendlines of the triangle have just two touchpoints each, making the structure relatively weak on both sides. This setup suggests that a breakout could occur with the slightest push, whether from buyers or sellers. Because neither side has established firm control, even a short burst of momentum could decide the next direction. The formation captures a true buyer-seller stalemate, where each minor price swing tests conviction but fails to confirm a clear trend. In short, the next breakout may depend on which side acts first, not necessarily which side is stronger. XLM’s Buyer-Seller Standoff: TradingView Want more token insights like this? Sign up for Editor Harsh Notariya’s Daily Crypto Newsletter here. The setup comes after a three-month decline of over 19%, so even a modest rebound could mark the start of a larger recovery phase if momentum builds. Selling Pressure Is Fading Fast The Wyckoff Volume Chart — which tracks buying and selling dominance through color-coded bars — supports this reading. The yellow bars, representing selling activity, have been steadily shrinking since yesterday. This reduction shows that sellers are gradually stepping back while buyers begin to absorb available supply. Selling Pressure Is Fading Fast: TradingView Interestingly, a similar pattern appeared between October 17 and 18, when reduced selling volume preceded a 15.1% XLM price rise soon after. The same structure now seems to be re-forming, reinforcing the idea that downside exhaustion is near. However, for a complete confirmation of seller-specific weakness, blue or green bars need to show up. Key Levels to Watch For The XLM Price Rebound Zooming into the chart, the XLM price continues to respect the triangle’s lower trendline, indicating that $0.30 remains a strong support level. If prices hold above $0.30, this level, a move toward $0.33 is likely, completing a 7.8% recovery. Breaking above $0.33 could open the path to $0.35 and eventually $0.39. Do note that while a push past $0.33 breaks the triangle’s upper trendline, it is already considered equally weak, as the line has only two touchpoints. That shows, if the XLM price peaks, breaking on the upside could be easier than breaking down. XLM Price Analysis: TradingView However, if XLM loses $0.30, the next key support lies near $0.28. However, breaking $0.30 would mean a trendline breakdown, and that could push the XLM price lower. For now, fading Wyckoff selling signals and a steady base near $0.30 show optimism. That means buyers might finally be regaining control of the Stellar (XLM) price structure, provided the market conditions do not worsen. The post Stellar (XLM) Buyer-Seller Standoff Could Be Ending And This Side Is About to Lose appeared first on BeInCrypto.
 Stellar’s XLM Holds Steady at $0.2975 as Weak Volume Caps Rebound Momentum
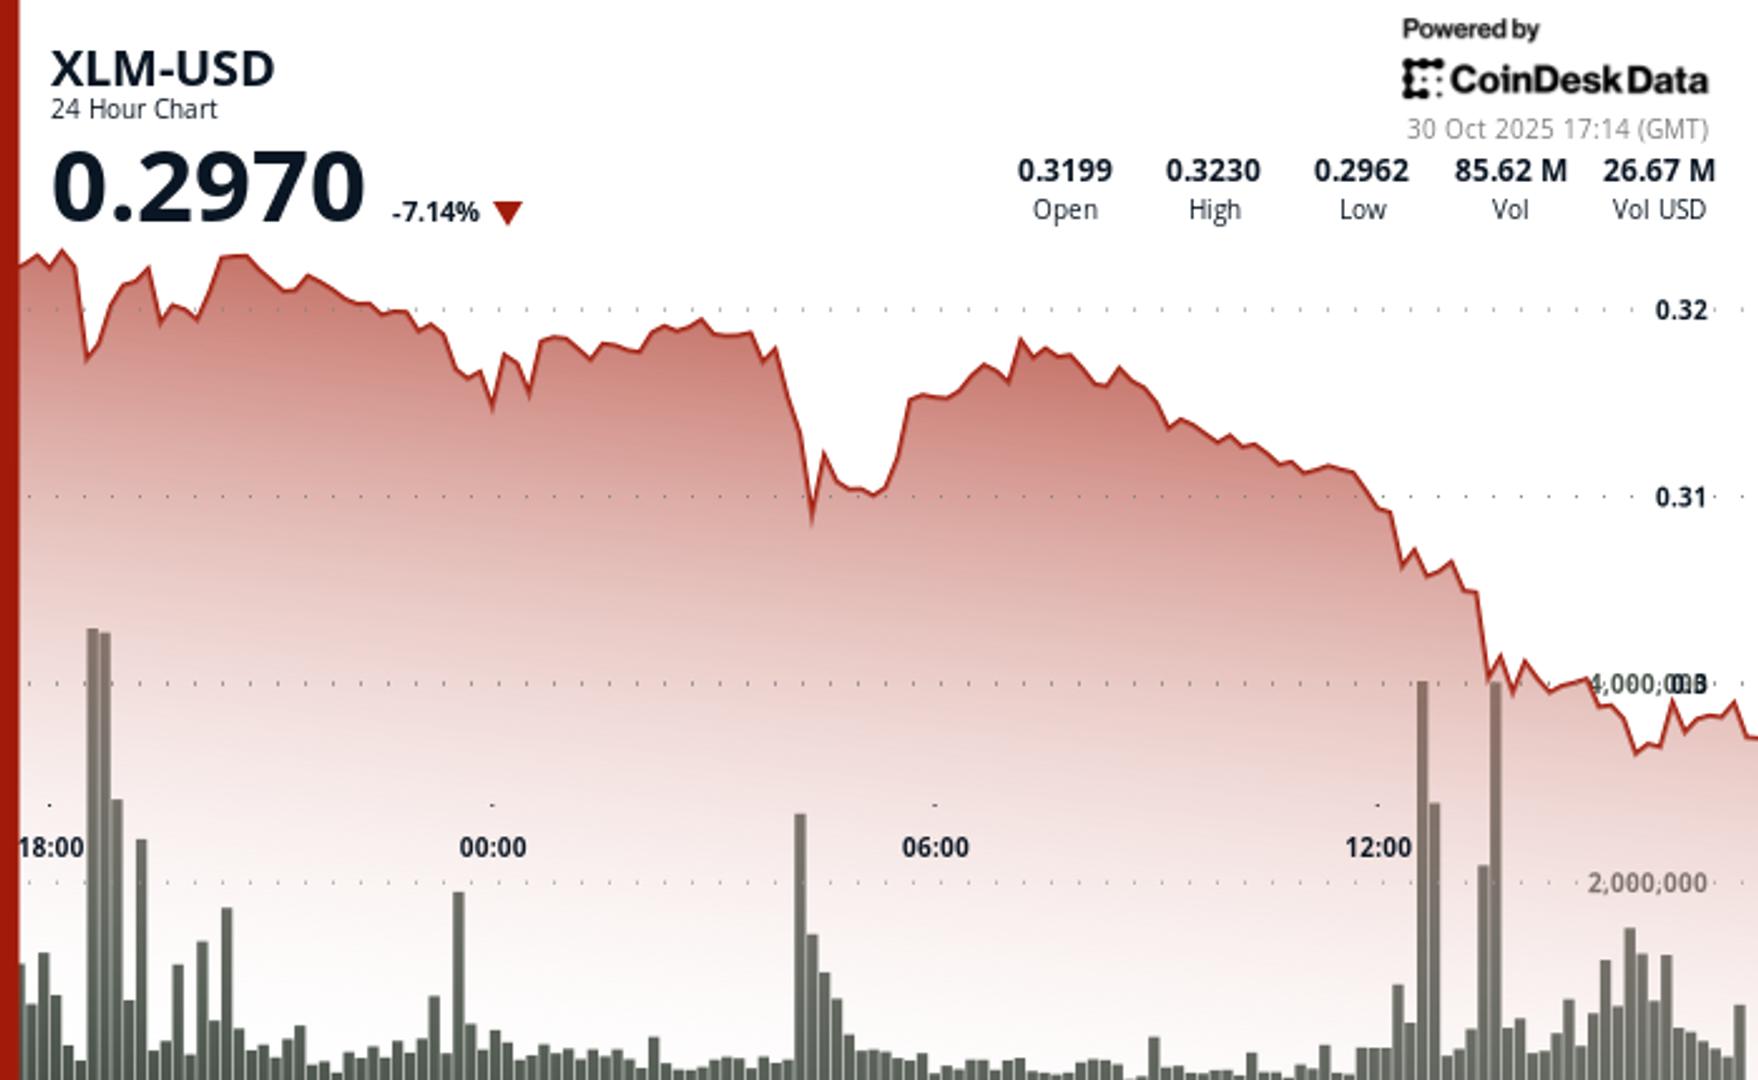
XLM consolidated near $0.2975 after a volatile session, underperforming the broader crypto market despite signs of accumulation near key support.
- Stellar’s XLM Holds Steady at $0.2975 as Weak Volume Caps Rebound Momentum
XLM consolidated near $0.2975 after a volatile session, underperforming the broader crypto market despite signs of accumulation near key support.
 BlockDAG’s nearly $435m presale nears end with a $0.005 entry in batch 32 while Stellar, SEI consolidate
BlockDAG presale nears $435m with 312k holders as final batch opens before its February 2026 exchange debut. Watching the market is a wild ride. The Stellar (XLM) price pattern is testing everyone’s patience, holding in a tight range, while the…
 These Altcoins Defy Market-Wide Crash as Bitcoin Struggles at $110K: Market Watch
Despite the positive developments on a macroeconomic front, bitcoin’s price nosedived in the past 12 hours to a multi-day low of under $108,000 and has struggled to post a substantial recovery. Most larger-cap alts have followed suit, including ETH and XRP, while ZEC, TRUMP, and M have charted impressive gains. BTC Falls Despite Rate Cut This highly eventful week started on the right foot for the primary cryptocurrency as it spiked toward $116,000 on a couple of occasions on Monday and Tuesday. However, its progress was halted at that crucial resistance, and the subsequent rejection after the failed Tuesday breakout attempt was quite painful. Nevertheless, BTC managed to stabilize at around $112,000 on Wednesday before the FOMC meeting when the US Fed was expected to cut the interest rates by 25 bps. Once that became official, BTC headed straight south and dumped to $110,000 at first before the bears took it all the way down to just under $108,000 on Thursday morning. Then came even more positive news on a macro level after the presidents of China and the US met, and Trump lowered some of the tariffs against Chinese products. BTC reacted well at first and jumped to over $111,500. However, that rally was short-lived as well, and the asset is close to losing the $110,000 support as of press time once again. Its market cap has tumbled below $2.2 trillion, while its dominance over the alts stands still close to 58% on CG. BTCUSD. Source: TradingView Big Alts in Red, ZEC Defies As mentioned above, most larger-cap alts have dropped in the past day as well, including ETH and XRP. The former has lost nearly 3% of value and sits below $3,900, while the latter is down by 3.5% and trades at $2.55. SOL, DOGE, ADA, and XLM are also in the red, while BNB, HYPE, LINK, BCH, and HBAR are with minor gains. Even more impressive price increases come from the likes of ZEC, TRUMP, and M. ZEC has rocketed by 9% daily to over $350, while M and TRUMP are up by around 6-7%. The total crypto market cap has shed around $80 billion in a day and is down to $3.810 trillion on CG. Cryptocurrency Market Overview Daily. Source: QuantifyCrypto The post These Altcoins Defy Market-Wide Crash as Bitcoin Struggles at $110K: Market Watch appeared first on CryptoPotato.