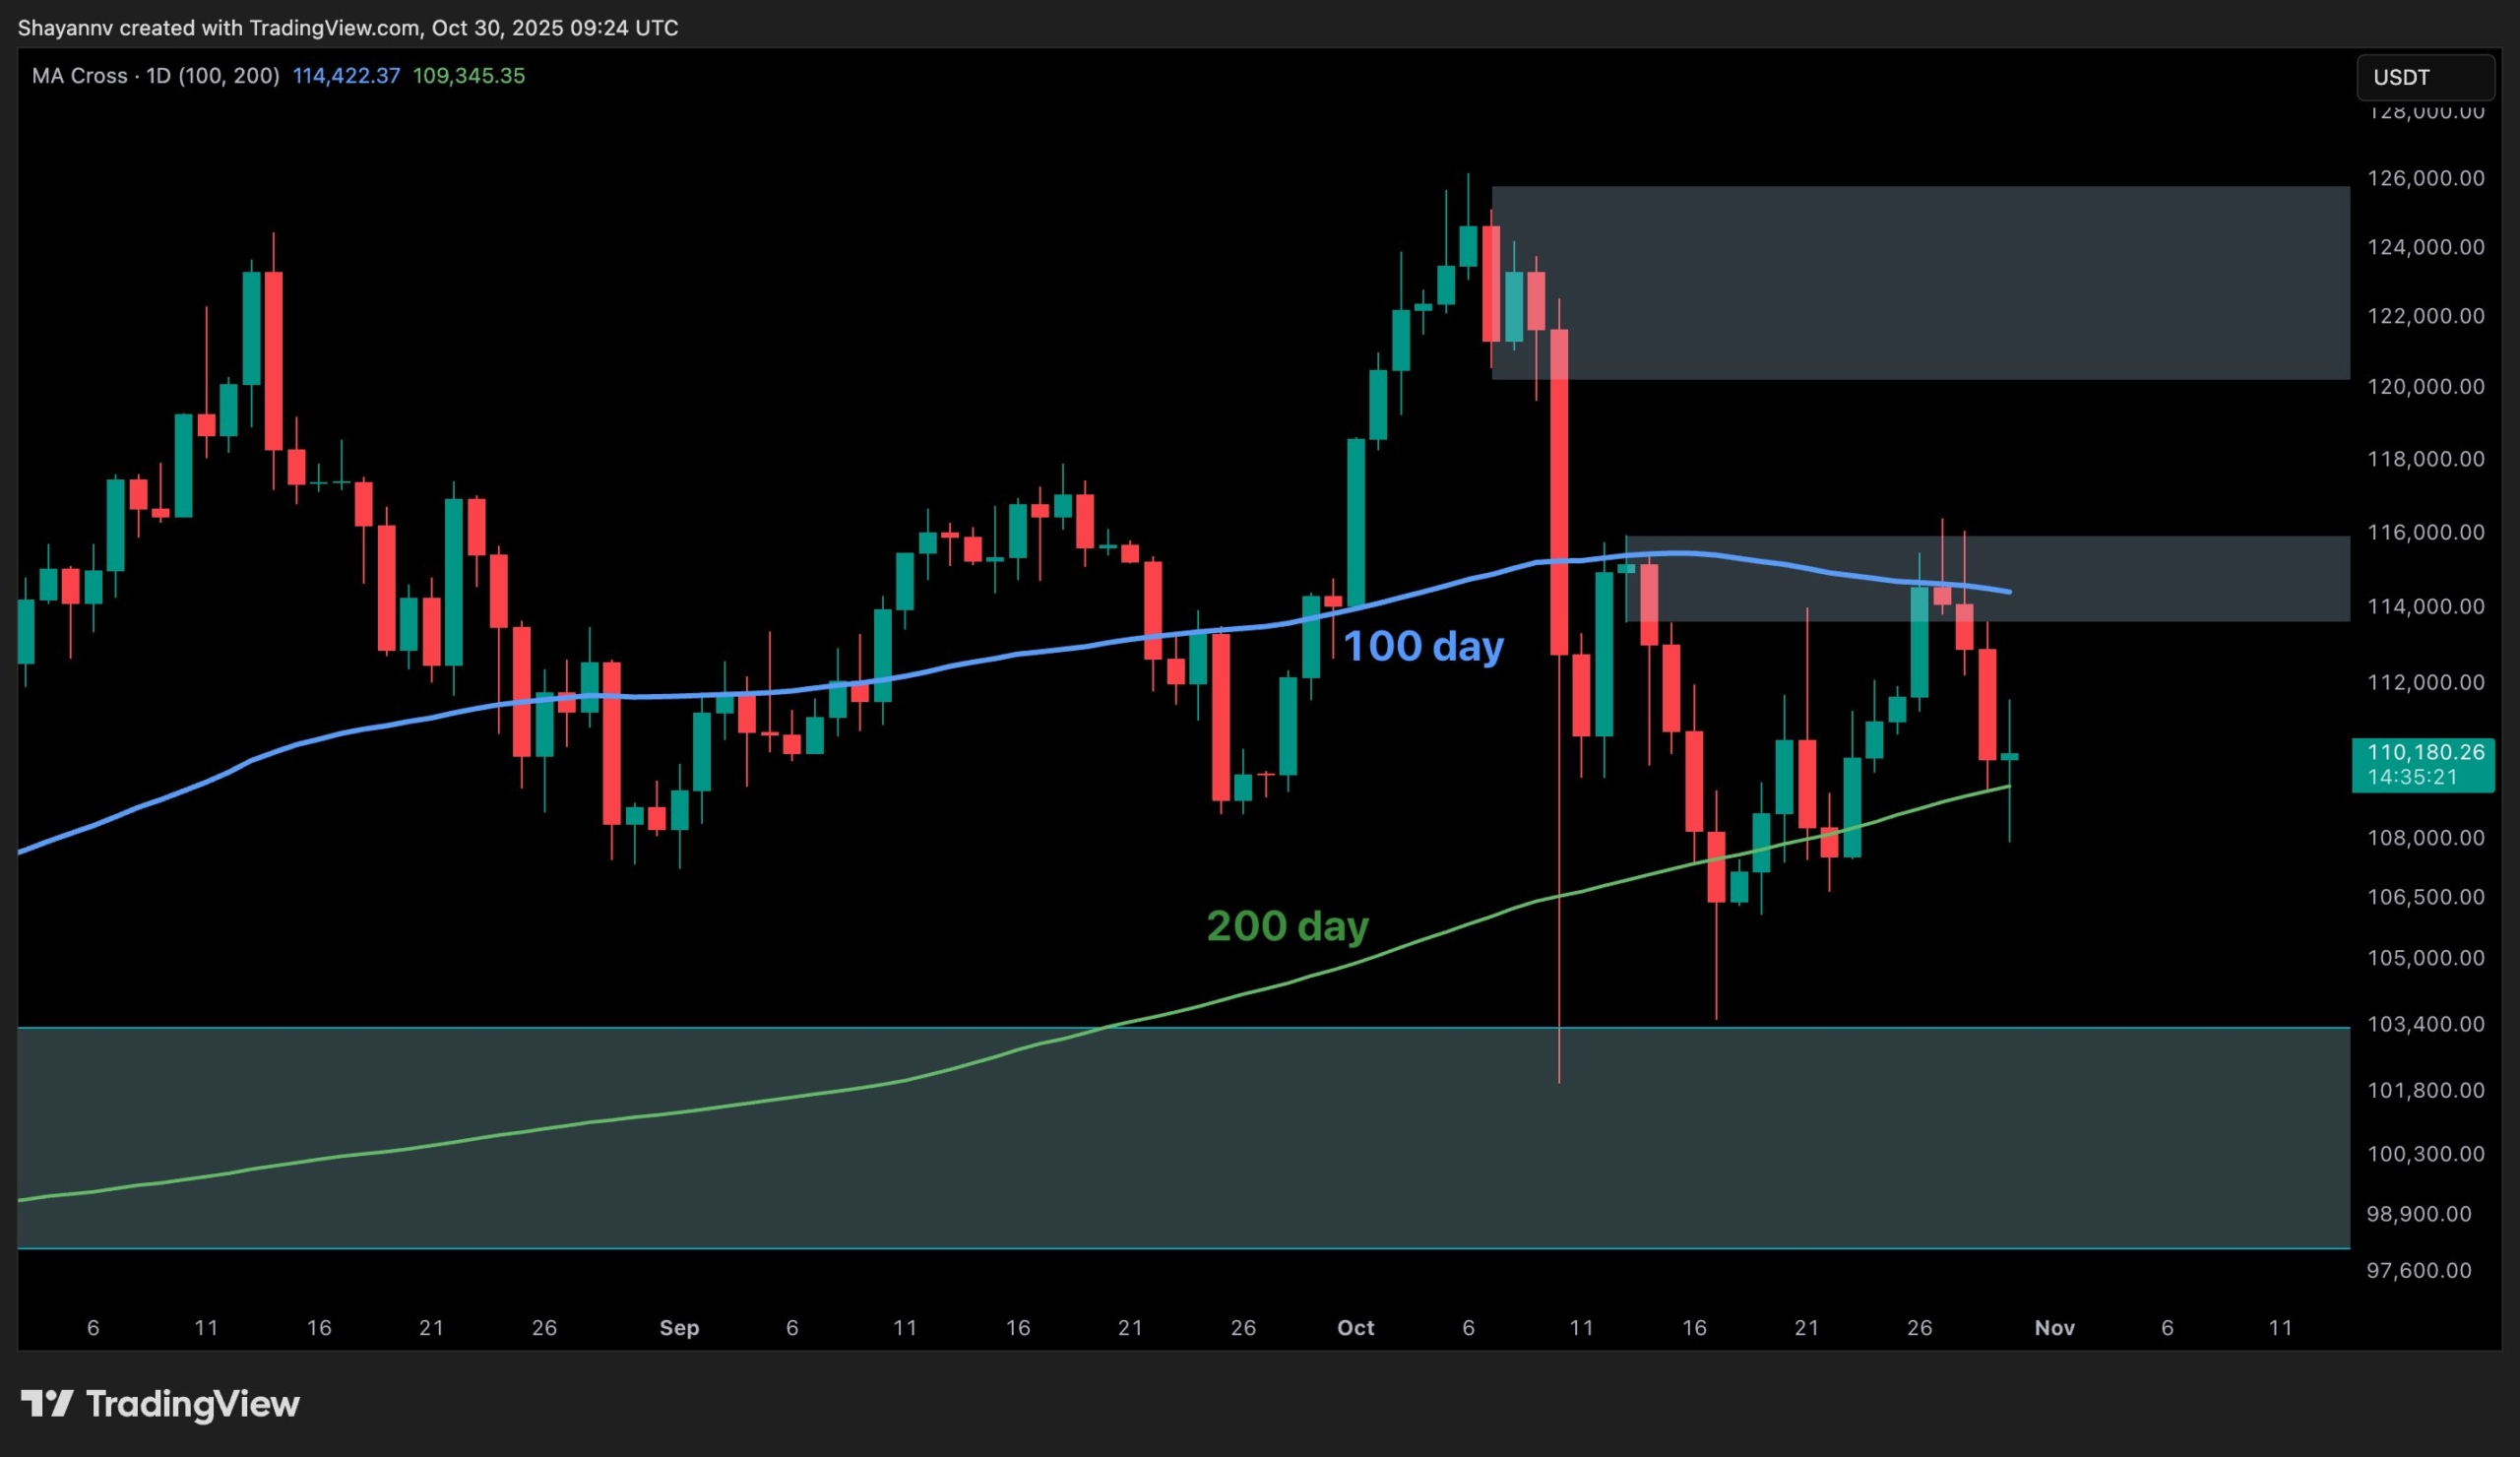
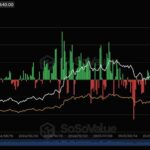
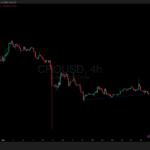
Bitcoin remains confined within a critical mid-range structure, oscillating between the 100- and 200-day moving averages. While the market recently attempted to reclaim higher ground, resistance around the 100-day MA has triggered renewed selling pressure. Technical Analysis By Shayan The Daily Chart On the daily timeframe, BTC has been trapped between the 200-day MA at $109K and the 100-day MA at $114K, both acting as major boundaries of equilibrium. The recent rejection from the 100-day MA, followed by a rebound off the 200-day MA, underscores the significance of this consolidation zone. The $114K–$116K region continues to serve as a dense supply area, coinciding with the midpoint of the recent range and institutional order flow. If Bitcoin closes decisively above $116K, it would signal renewed strength supported by improving macro liquidity conditions after the Fed’s rate cut, paving the way for a potential rally toward $120K–$122K. Conversely, losing the $109K–$110K region could extend the corrective phase toward the $102K–$104K institutional demand zone, which previously acted as a strong accumulation base. The 4-Hour Chart On the 4-hour structure, BTC continues to respect an ascending trendline connecting the higher lows formed since mid-October. The recent pullback from the $116K resistance zone has driven price back toward this rising support, aligning with the $108K–$109K high-liquidity area. This region represents a key short-term decision point. A rebound from here would validate the ongoing bullish structure and potentially initiate another leg toward $115K–$116K. However, a confirmed breakdown below $108K would likely lead to a retest of the $102K demand block before any sustainable reversal attempt. The overall setup still points to volatility compression, suggesting that Bitcoin is preparing for a significant breakout move in the coming days as global markets digest the FOMC’s dovish stance and improving geopolitical outlook. Spot Sentiment Analysis By Shayan Spot Average Order Size provides valuable insight into market participation dynamics. Historically, expansions in large spot order sizes (green clusters) have coincided with accumulation phases led by institutional investors, while smaller retail-dominated orders (red clusters) typically mark distribution or sideways markets. Currently, the metric shows a notable decline in large order activity, reflecting short-term caution despite improving macro conditions. This pattern mirrors prior consolidation phases before major expansions, suggesting that the market may once again be in the re-accumulation stage. If large order activity increases near the $108K–$110K region, it would confirm renewed institutional accumulation, potentially aligning with the liquidity injection effects of the recent U.S. rate cut and the trade stabilization between the U.S. and China. Together, these catalysts could lay the groundwork for Bitcoin’s next macro bullish leg. The post Bitcoin Price Analysis: BTC Risks Falling Toward $100K if Current Support Breaks appeared first on CryptoPotato.
More Headlines

Bitcoin Records Over $300B Spot Volume In October – Investors Shift Away From Leverage
NewsBTC
Bitcoin ETF Outflows Signal Weak Sentiment While Ethereum Consolidates Near $4,100
99bitcoins

Why Is Crypto Down Today? – October 30, 2025
CryptoNews.com
Cronos Smarturn Upgrade Explained: Is CRO Price Set to Skyrocket?
99bitcoins

Bitcoin Price Prediction: Grok AI Says Bitcoin Will Hit $200K By End of 2025 And It’s Pure Analysis, Not Human Belief – Is This Really Possible?
CryptoNews.com

Bitcoin Crashes After Fed Rate Cut as Traders Fall for ‘Buy the Rumor, Sell the News’ Trap
CryptoPotato