Pi Coin (PI) price has gained nearly 3% this week, offering a small relief after a 44% drop over three months. The rebound looks fragile, though. The chart shows pressure building between buyers returning quietly and sellers waiting for momentum to fade — leaving Pi’s next move hanging by a thread. Buyers and Sellers Pull in Opposite Directions On the daily Pi Coin price chart, momentum and volume tell different stories. The Moving Average Convergence Divergence (MACD) — a tool that tracks when trend strength changes — is flattening after weeks of staying above its signal line. The last two times this line dropped below, on August 25 and September 21, PI fell 9% and 49%. A similar bearish crossover now could spark another leg down if sellers stay dominant. Pi Coin Eyes A Bearish Crossover: TradingView Want more token insights like this? Sign up for Editor Harsh Notariya’s Daily Crypto Newsletter here. But the On-Balance Volume (OBV), which measures whether trading volume supports price moves, is trying to turn the tide. OBV has been stuck under a descending trendline since early October, showing weak buying strength. Still, each touch of that line led to short bounces — like the 8% rise on November 10. Sellers Dominant Buy Buyers Are Trying To Come In: TradingView Pi Coin’s OBV is still negative but rising slightly, showing that buyers are testing the waters again. A breakout above its trendline could cancel the bearish MACD setup and signal early recovery strength. However, if the OBV line starts to drop, the MACD crossover (bearish) might take shape earlier than expected. Triangle Pressure Builds as Smart Money Waits for a Pi Coin Price Break That same push and pull between buyers and sellers now shows clearly on the 12-hour chart. The Pi Coin price trades inside a symmetrical triangle, where price compresses between rising and falling lines — a visual reflection of indecision. A close above $0.23 could confirm an upward break, opening room toward $0.25 and even $0.27. If the lower line near $0.20 fails instead, the PI price might revisit $0.19 or even $0.15. Meanwhile, the Smart Money Index (SMI) — which follows how early investors move — has curled upward after touching its signal line on November 11. It’s not a full reversal yet, but it suggests some big players are starting to expect a rebound. Pi Coin Price Analysis: TradingView If SMI makes a higher high and OBV breaks its ceiling, PI could finally escape the triangle and rebuild momentum. For now, Pi Coin’s rebound really does hang by a thread — and both sides are pulling hard to decide whether it snaps or stretches toward a breakout. The post Pi Coin Rebound Hope Hangs by a Thread — And It’s Being Pulled From Both Sides appeared first on BeInCrypto.

More Headlines

Zcash Plunges 37% as Arthur Hayes Issues Urgent Warning to Holders: Withdraw or Lose Privacy
CryptoNews.com

Ethereum Whales Inject $900 Million Despite Bearish Crossover Risks — But Why?
BeInCrypto

Dogecoin price holds $0.15 as a Three Drives pattern forms: Is the bottom near?
Crypto.News

Bitcoin Price Watch: Traders Eye $106K Ceiling in Volatile Push
BitRSS
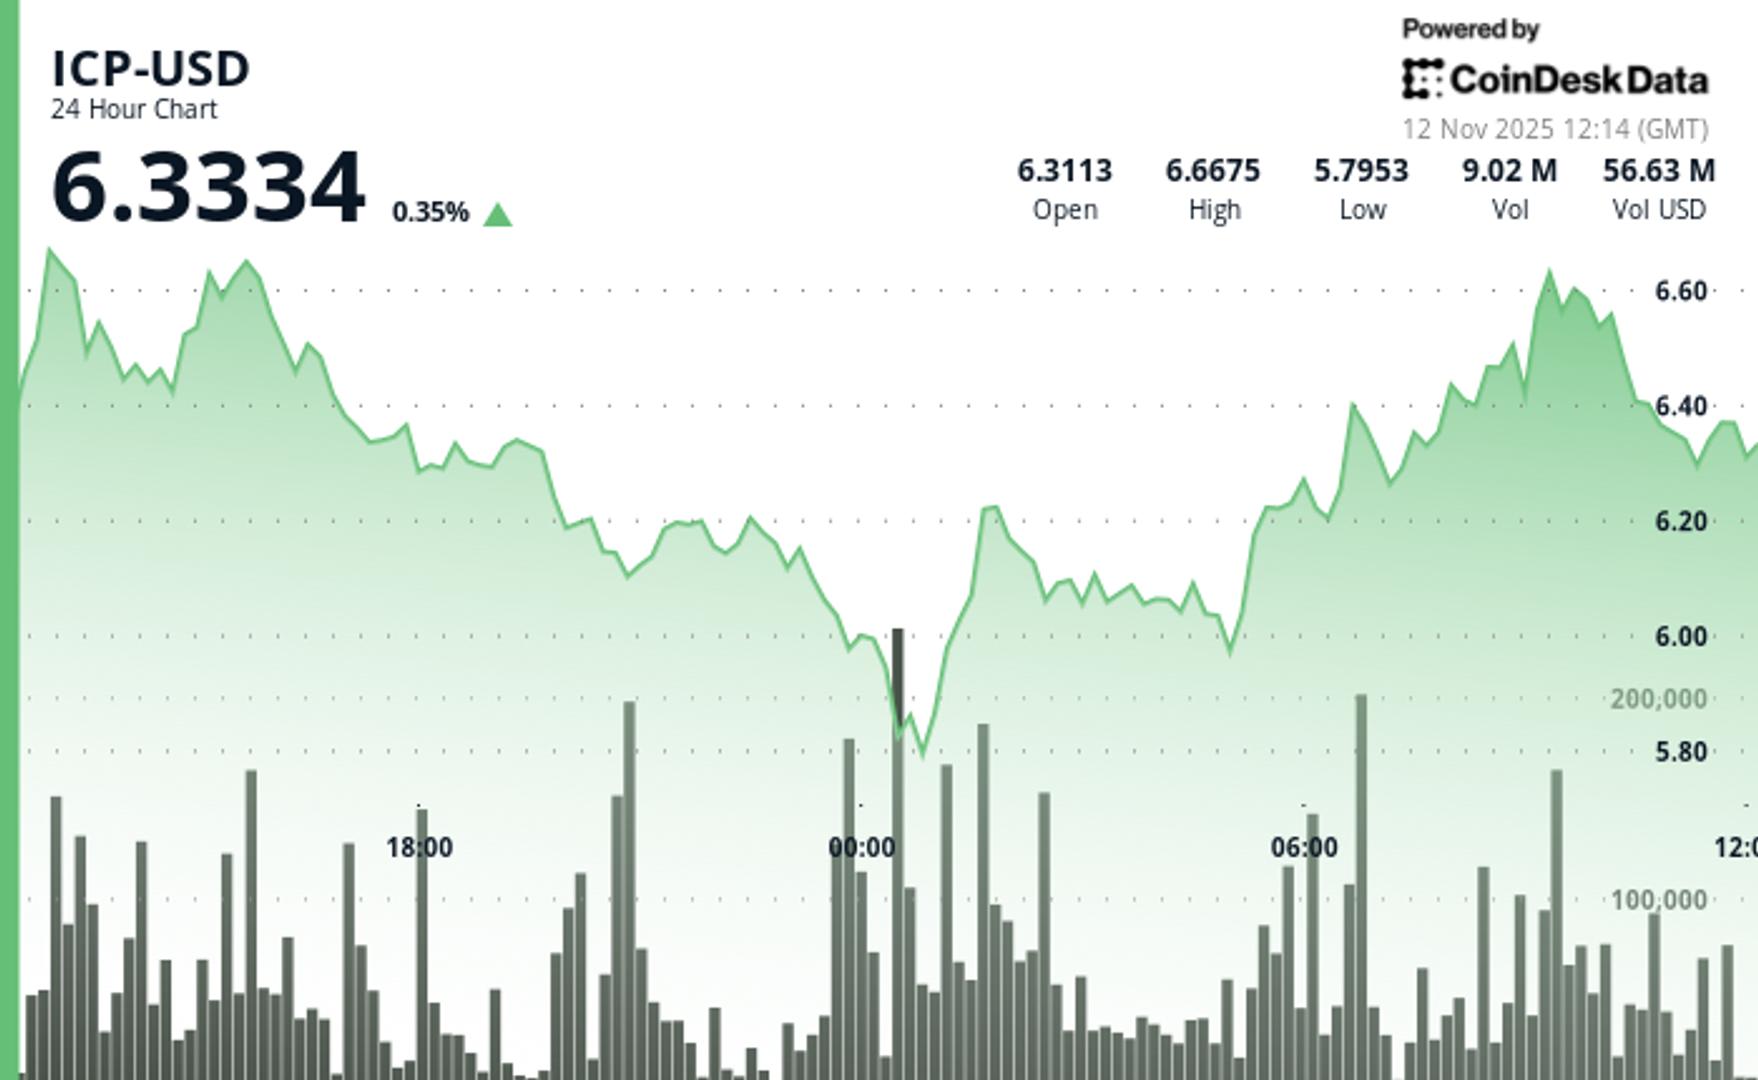
ICP Slips as Consolidation Phase Holds Above Key Support
BitRSS

Evernorth CEO Teases Massive XRP Accumulation Beyond $1 Billion
BitCoinist